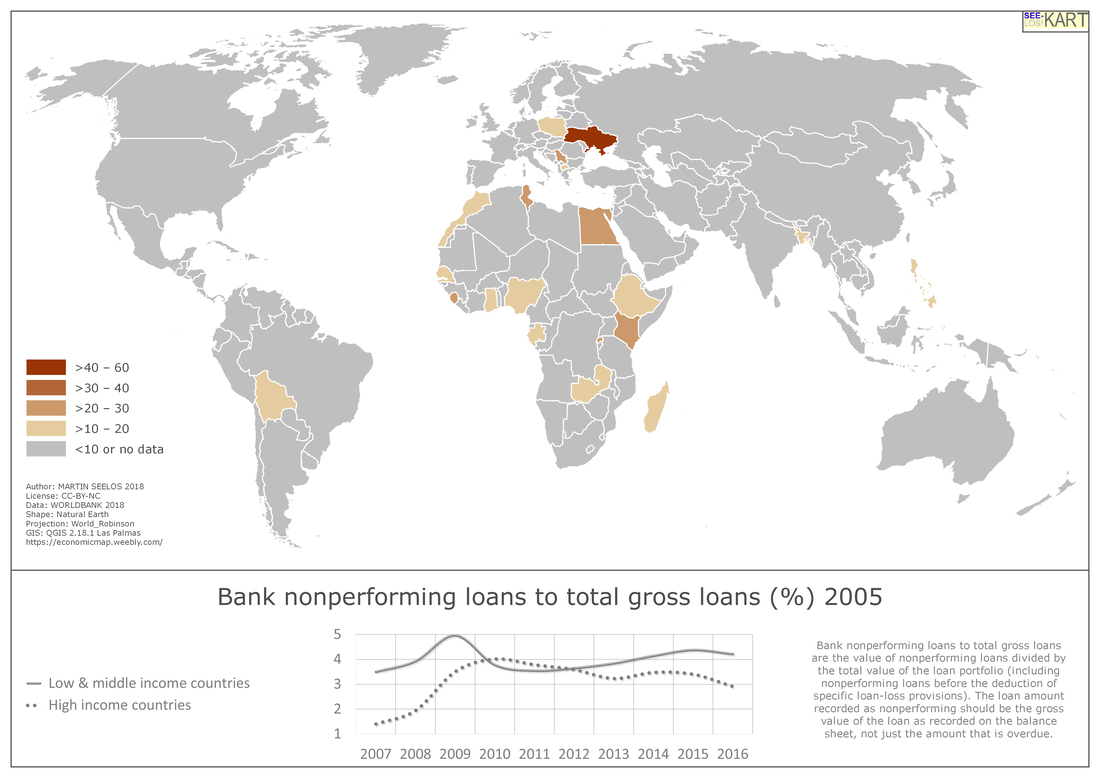
World: Bank Nonperforming Loans, 2005–2015, 16 maps
|
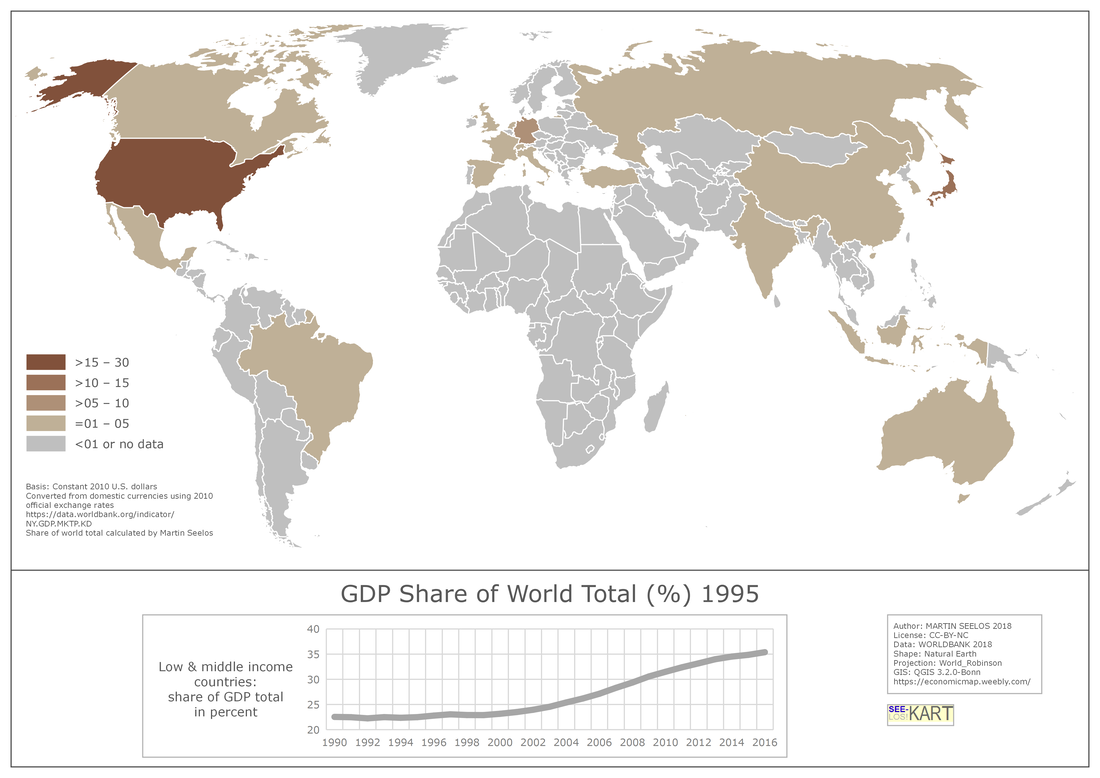
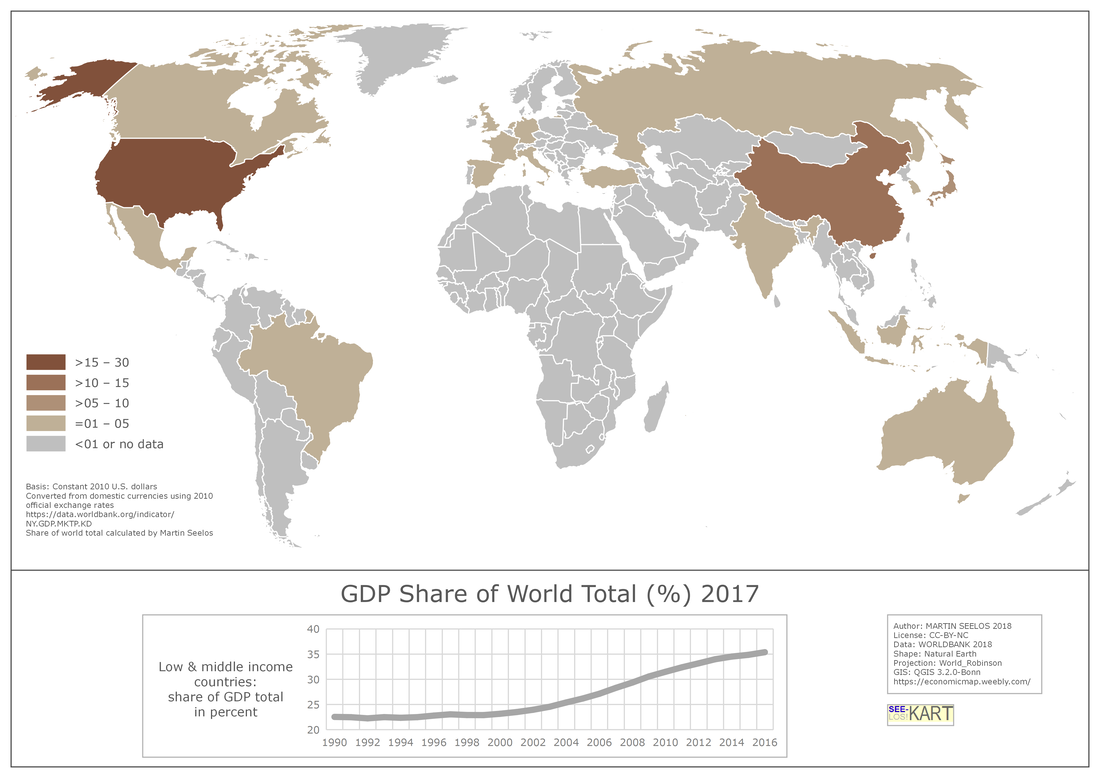
GDP: Share of World Total, 1995, 2000, 2005, 2010, 2015
|
GDP: Share of World Total, 1997–2017, 11 maps
|
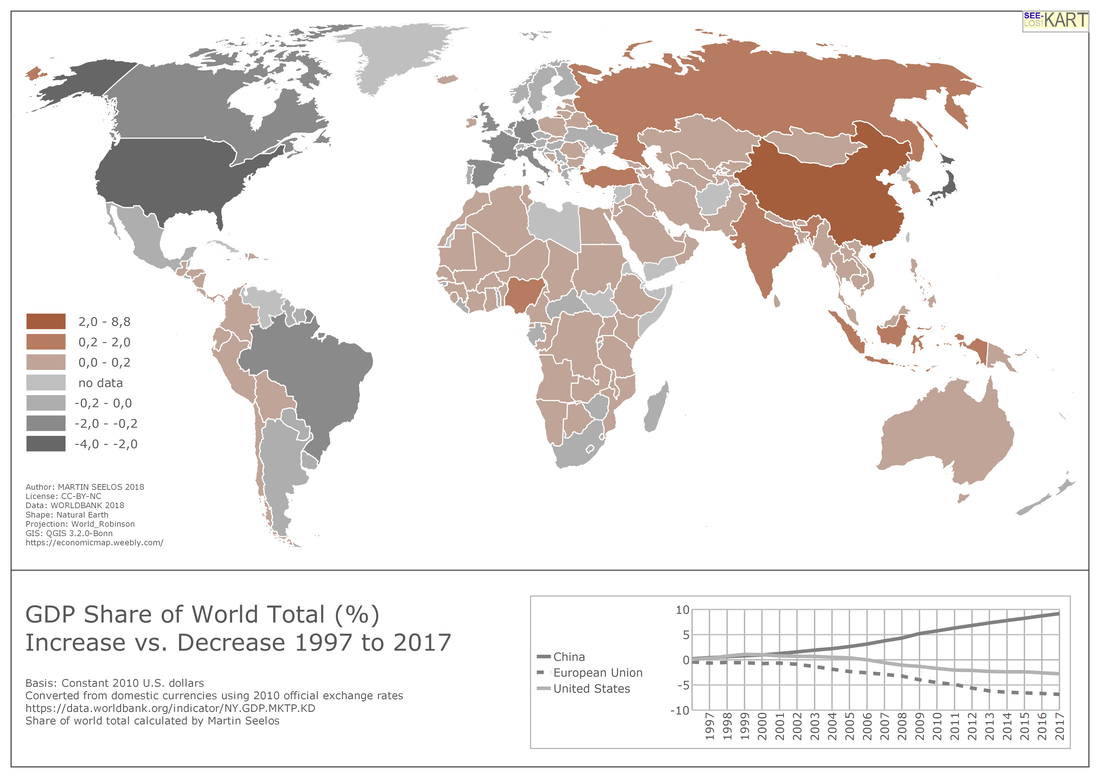
GDP Share of World Total (%)
Increase vs. Decrease 1997 to 2017
|
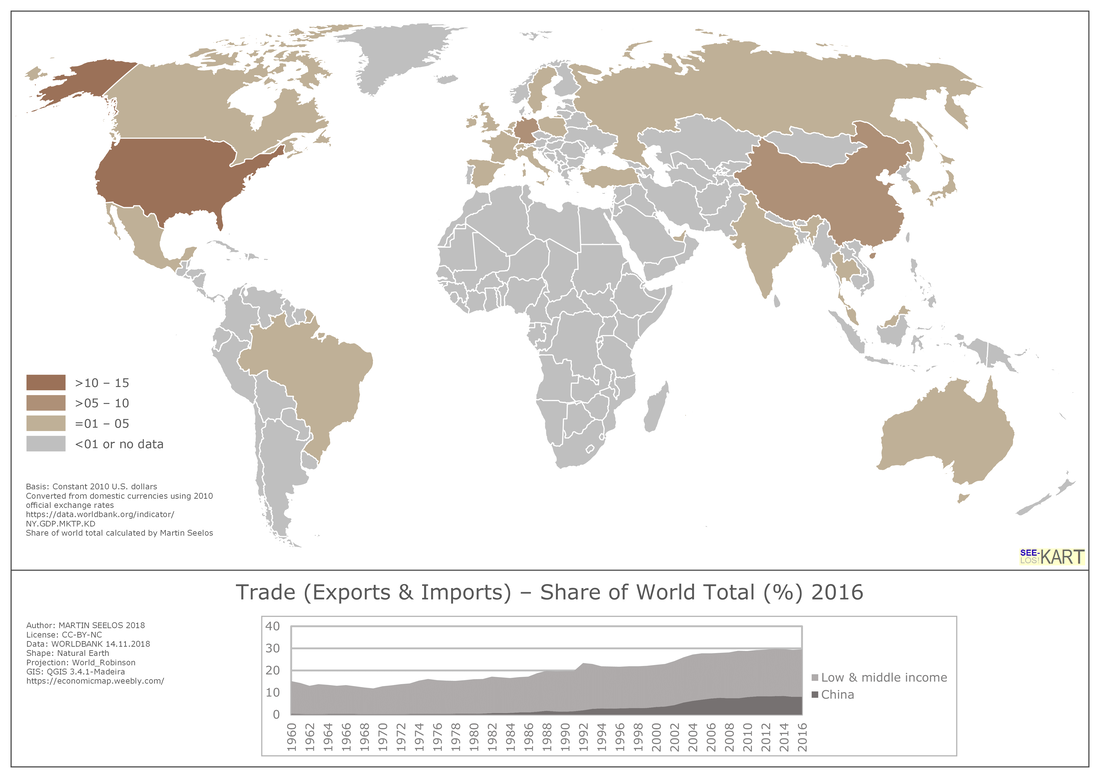
Trade share of world total, 1991–2016, 26 maps
|
